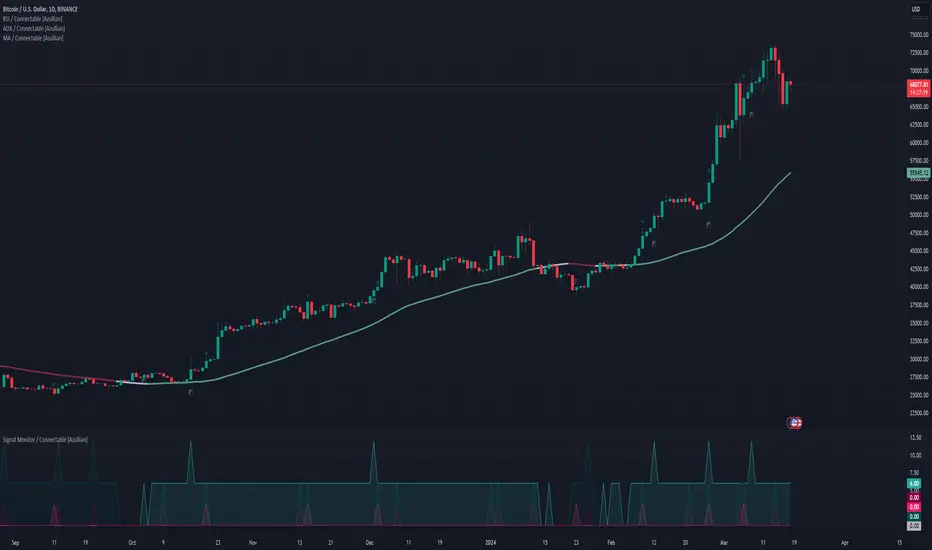
Signal Monitor / Connectable [Azullian]The connectable signal monitor is a connectable tool to help test, visualize signal weights. Like all connectable indicators , it interacts through the TradingView input source, which serves as a signal connector to link indicators to each other. All connectable indicators send signal weight to the next node in the system until it reaches either a connectable signal monitor, signal filter and/or strategy.
Let's review the separate parts of this indicator.
█ INPUTS
We've provided 3 inputs for connecting indicators or chains (1→, 2→, 3→) which are all set to 'Close' by default.
An input has several controls:
• Enable disable: Toggle the entire input on or off
• Input: Connect indicators here, choose indicators with a compatible : Signal connector.
■ VISUALS
• ☼: Brightness % : Set the opacity for the signal curves
• 🡓: ES Color : Set the color for the ES: Entry Short signal
• ⭳: XS Color : Set the color for the XS: Exit Short signal
• ⌥: Plot mode : Set the plotting mode
○ Signals IN: Show all signals
○ Signals OUT: Show only scoring signals
• 🡑: EL Color : Set the color for the EL: Enter Long signal
• ⭱: XL Color : Set the color for the XL: Exit Long signal
█ USAGE OF CONNECTABLE INDICATORS
■ Connectable chaining mechanism
Connectable indicators can be connected directly to the signal monitor, signal filter or strategy , or they can be daisy chained to each other while the last indicator in the chain connects to the connectable signal monitor, signal filter or strategy . When using a signal filter or signal monitor you can chain the filter to the strategy input to make your chain complete.
• Direct chaining: Connect an indicator directly to the signal monitor, signal filter or strategy through the provided inputs (→).
• Daisy chaining: Connect indicators using the indicator input (→). The first in a daisy chain should have a flow (⌥) set to 'Indicator only'. Subsequent indicators use 'Both' to pass the previous weight. The final indicator connects to the signal monitor, signal filter, or strategy.
■ Set up the signal monitor with a connectable indicator and strategy
Let's connect the MACD to a connectable signal monitor :
1. Load all relevant indicators
• Load MACD / Connectable
• Load Signal monitor / Connectable
2. Signal Monitor: Connect the MACD to the Signal Monitor
• Open the signal monitor settings
• Choose one of the three input dropdowns (1→, 2→, 3→) and choose : MACD / Connectable: Signal Connector
• Toggle the enable box before the connected input to enable the incoming signal
Now that everything is connected, you'll notice green spikes in the signal monitor representing long signals, and red spikes indicating short signals.
█ BENEFITS
• Adaptable Modular Design: Arrange indicators in diverse structures via direct or daisy chaining, allowing tailored configurations to align with your analysis approach.
• Streamlined Backtesting: Simplify the iterative process of testing and adjusting combinations, facilitating a smoother exploration of potential setups.
• Intuitive Interface: Navigate TradingView with added ease. Integrate desired indicators, adjust settings, and establish alerts without delving into complex code.
• Signal Weight Precision: Leverage granular weight allocation among signals, offering a deeper layer of customization in strategy formulation.
• Advanced Signal Filtering: Define entry and exit conditions with more clarity, granting an added layer of strategy precision.
• Clear Visual Feedback: Distinct visual signals and cues enhance the readability of charts, promoting informed decision-making.
• Standardized Defaults: Indicators are equipped with universally recognized preset settings, ensuring consistency in initial setups across different types like momentum or volatility.
• Reliability: Our indicators are meticulously developed to prevent repainting. We strictly adhere to TradingView's coding conventions, ensuring our code is both performant and clean.
█ COMPATIBLE INDICATORS
Each indicator that incorporates our open-source 'azLibConnector' library and adheres to our conventions can be effortlessly integrated and used as detailed above.
For clarity and recognition within the TradingView platform, we append the suffix ' / Connectable' to every compatible indicator.
█ COMMON MISTAKES, CLARIFICATIONS AND TIPS
• Removing an indicator from a chain: Deleting a linked indicator and confirming the "remove study tree" alert will also remove all underlying indicators in the object tree. Before removing one, disconnect the adjacent indicators and move it to the object stack's bottom.
• Point systems: The azLibConnector provides 500 points for each direction (EL: Enter long, XL: Exit long, ES: Enter short, XS: Exit short) Remember this cap when devising a point structure.
• Flow misconfiguration: In daisy chains the first indicator should always have a flow (⌥) setting of 'indicator only' while other indicator should have a flow (⌥) setting of 'both'.
• Hide attributes: As connectable indicators send through quite some information you'll notice all the arguments are taking up some screenwidth and cause some visual clutter. You can disable arguments in Chart Settings / Status line.
• Layout and abbreviations: To maintain a consistent structure, we use abbreviations for each input. While this may initially seem complex, you'll quickly become familiar with them. Each abbreviation is also explained in the inline tooltips.
• Inputs: Connecting a connectable indicator directly to the strategy delivers the raw signal without a weight threshold, meaning every signal will trigger a trade.
█ A NOTE OF GRATITUDE
Through years of exploring TradingView and Pine Script, we've drawn immense inspiration from the community's knowledge and innovation. Thank you for being a constant source of motivation and insight.
█ RISK DISCLAIMER
Azullian's content, tools, scripts, articles, and educational offerings are presented purely for educational and informational uses. Please be aware that past performance should not be considered a predictor of future results.
在腳本中搜尋"the strat"
Crypto MVRV ZScore - Strategy [PresentTrading]█ Introduction and How it is Different
The "Crypto Valuation Extremes: MVRV ZScore - Strategy " represents a cutting-edge approach to cryptocurrency trading, leveraging the Market Value to Realized Value (MVRV) Z-Score. This metric is pivotal for identifying overvalued or undervalued conditions in the crypto market, particularly Bitcoin. It assesses the current market valuation against the realized capitalization, providing insights that are not apparent through conventional analysis.
BTCUSD 6h Long/Short Performance
Local
█ Strategy, How It Works: Detailed Explanation
The strategy leverages the Market Value to Realized Value (MVRV) Z-Score, specifically designed for cryptocurrencies, with a focus on Bitcoin. This metric is crucial for determining whether Bitcoin is currently undervalued or overvalued compared to its historical 'realized' price. Below is an in-depth explanation of the strategy's components and calculations.
🔶Conceptual Foundation
- Market Capitalization (MC): This represents the total dollar market value of Bitcoin's circulating supply. It is calculated as the current price of Bitcoin multiplied by the number of coins in circulation.
- Realized Capitalization (RC): Unlike MC, which values all coins at the current market price, RC is computed by valuing each coin at the price it was last moved or traded. Essentially, it is a summation of the value of all bitcoins, priced at the time they were last transacted.
- MVRV Ratio: This ratio is derived by dividing the Market Capitalization by the Realized Capitalization (The ratio of MC to RC (MVRV Ratio = MC / RC)). A ratio greater than 1 indicates that the current price is higher than the average price at which all bitcoins were purchased, suggesting potential overvaluation. Conversely, a ratio below 1 suggests undervaluation.
🔶 MVRV Z-Score Calculation
The Z-Score is a statistical measure that indicates the number of standard deviations an element is from the mean. For this strategy, the MVRV Z-Score is calculated as follows:
MVRV Z-Score = (MC - RC) / Standard Deviation of (MC - RC)
This formula quantifies Bitcoin's deviation from its 'normal' valuation range, offering insights into market sentiment and potential price reversals.
🔶 Spread Z-Score for Trading Signals
The strategy refines this approach by calculating a 'spread Z-Score', which adjusts the MVRV Z-Score over a specific period (default: 252 days). This is done to smooth out short-term market volatility and focus on longer-term valuation trends. The spread Z-Score is calculated as follows:
Spread Z-Score = (Market Z-Score - MVVR Ratio - SMA of Spread) / Standard Deviation of Spread
Where:
- SMA of Spread is the simple moving average of the spread over the specified period.
- Spread refers to the difference between the Market Z-Score and the MVRV Ratio.
🔶 Trading Signals
- Long Entry Condition: A long (buy) signal is generated when the spread Z-Score crosses above the long entry threshold, indicating that Bitcoin is potentially undervalued.
- Short Entry Condition: A short (sell) signal is triggered when the spread Z-Score falls below the short entry threshold, suggesting overvaluation.
These conditions are based on the premise that extreme deviations from the mean (as indicated by the Z-Score) are likely to revert to the mean over time, presenting opportunities for strategic entry and exit points.
█ Practical Application
Traders use these signals to make informed decisions about opening or closing positions in the Bitcoin market. By quantifying market valuation extremes, the strategy aims to capitalize on the cyclical nature of price movements, identifying high-probability entry and exit points based on historical valuation norms.
█ Trade Direction
A unique feature of this strategy is its configurable trade direction. Users can specify their preference for engaging in long positions, short positions, or both. This flexibility allows traders to tailor the strategy according to their risk tolerance, market outlook, or trading style, making it adaptable to various market conditions and trader objectives.
█ Usage
To implement this strategy, traders should first adjust the input parameters to align with their trading preferences and risk management practices. These parameters include the trade direction, Z-Score calculation period, and the thresholds for long and short entries. Once configured, the strategy automatically generates trading signals based on the calculated spread Z-Score, providing clear indications for potential entry and exit points.
It is advisable for traders to backtest the strategy under different market conditions to validate its effectiveness and adjust the settings as necessary. Continuous monitoring and adjustment are crucial, as market dynamics evolve over time.
█ Default Settings
- Trade Direction: Both (Allows for both long and short positions)
- Z-Score Calculation Period: 252 days (Approximately one trading year, capturing a comprehensive market cycle)
- Long Entry Threshold: 0.382 (Indicative of moderate undervaluation)
- Short Entry Threshold: -0.382 (Signifies moderate overvaluation)
These default settings are designed to balance sensitivity to market valuation extremes with a pragmatic approach to trade execution. They aim to filter out noise and focus on significant market movements, providing a solid foundation for both new and experienced traders looking to exploit the unique insights offered by the MVRV Z-Score in the cryptocurrency market.

Backtest any Indicator v5Happy Trade,
here you get the opportunity to backtest any of your indicators like a strategy without converting them into a strategy. You can choose to go long or go short and detailed time filters. Further more you can set the take profit and stop loss, initial capital, quantity per trade and set the exchange fees. You get an overall result table and even a detailed, scroll-able table with all trades. In the Image 1 you see the provided info tables about all Trades and the Result Summary. Further more every trade is marked by a background color, Labels and Levels. An opening Label with the trade direction and trade number. A closing Label again with the trade number, the trades profit in % and the total amount of $ after all past trades. A green line for the take profit level and a red line for the stop loss.
Image 1
Example
For this description we choose the Stochastic RSI indicator from TradingView as it is. In Image 2 is shown the performance of it with decent settings.
Timeframe=45, BTCUSD, 2023-08-01 - 2023-10-20
Stoch RSI: k=30, d=40, RSI-length=140, stoch-length=140
Backtest any Indicator: input signal=Stoch RSI, goLong, take profit=9.1%, stop loss=2.5%, start capital=1000$, qty=5%, fee=0.1%, no Session Filter
Image 2
Usage
1) You need to know the name of the boolean (or integer) variable of your indicator which hold the buy condition. Lets say that this boolean variable is called BUY. If this BUY variable is not plotted on the chart you simply add the following code line at the end of your pine script.
For boolean (true/false) BUY variables use this:
plot(BUY ? 1:0,'Your buy condition hold in that variable BUY',display = display.data_window)
And in case your script's BUY variable is an integer or float then use instate the following code line:
plot(BUY ,'Your buy condition hold in that variable BUY',display = display.data_window)
2) Probably the name of this BUY variable in your indicator is not BUY. Simply replace in the code line above the BUY with the name of your script's trade condition variable.
3) Save your changed Indicator script.
4) Then add this 'Backtest any Indicator' script to the chart ...
5) and go to the settings of it. Choose under "Settings -> Buy Signal" your Indicator. So in the example above choose .
The form is usually: ' : BUY'. Then you see something like Image 2
6) Decide which trade direction the BUY signal should trigger. A go Long or a go Short by set the hook or not.
Now you have a backtest of your Indicator without converting it into a strategy. You may change the setting of your Indicator to the best results and setup the following strategy settings like Time- and Session Filter, Stop Loss, Take Profit etc. More of it below in the section Settings Menu.
Appereance
In the Image 2 you see on the right side the List of Trades . To scroll down you go into the settings again and decrease the scroll value. So you can see all trades that have happened before. In case there is an open trade you will find it at the last position of the list.
Every Long trade is green back grounded while Short trades are red.
Every trade begins with a label that show goLong or goShort and its number. And ends with another label again with its number, Profit in % and the resulting total amount of cash.
If activated you further see the Take Profit as a green line and the Stop Loss as a orange line. In the settings you can set their percentage above or below the entry price.
You also see the Result Summary below. Here you find the usual stats of a strategy of all closed trades. The profit after total amount of fees , amount of trades, Profit Factor and the total amount of fees .
Settings Menu
In the settings menu you will find the following high-lighted sections. Most of the settings have a question mark on their right side. Move over it with the cursor to read specific explanation.
Input Signal of your Indicator: Under Buy you set the trade signal of your Indicator. And under Target you set the value when a trade should happen. In the Example with the Stochastic RSI above we used 20. Below you can set the trade direction, let it be go short when hooked or go long when unhooked.
Trade Settings & List of Trades: Take Profit set the target price of any trade. Stop Loss set the price to step out when a trade goes the wrong direction. Check mark the List of Trades to see any single trade with their stats. In case that there are more trades as fits in the list you can scroll down the list by decrease the value Scroll .
Time Filter: You can set a Start Time or deactivate it by leave it unhooked. The same with End Time .
Session Filter: here you can choose to activate it on weekly base. Which days of the week should be trading and those without. And also on daily base from which time on and until trade are possible. Outside of all times and sessions there will be no new trades if activated.
Invest Settings: here you can choose the amount of cash to start with. The Quantity percentage define for every trade how much of the cash should be invested and the Fee percentage which have to be payed every trade. Open position and closing position.
Other Announcements
This Backtest script don't use the strategy functions of TradingView. It is programmed as an indicator. All trades get executed at candle closing. This script use the functionality "Indicator-on-Indicator" from TradingView.
Conclusion
So now it is your turn, take your promising indicators and connect it to that Backtest script. With it you get a fast impression of how successful your indicator will trade. You don't have to relay on coders who maybe add cheating code lines. Further more you can check with the Time Filter under which market condition you indicator perform the best or not so well. Also with the Session Filter you can sort out repeating good market conditions for your indicator. Even you can check with the GoShort XOR GoLong check mark the trade signals of you indicator in opposite trade direction with one click. And compare your indicators under the same conditions and get the results just after 2 clicks. Thanks to the in-build fee setting you get an impression how much a 0.1% fee cost you in total.
Cheers

PresentTrend RMI Synergy - Strategy [presentTrading] █ Introduction and How it is Different
The "PresentTrend RMI Synergy Strategy" is the combined power of the Relative Momentum Index (RMI) and a custom presentTrend indicator. This strategy introduces a multifaceted approach, integrating momentum analysis with trend direction to offer traders a more nuanced and responsive trading mechanism.
BTCUSD 6h L/S Performance
Local
█ Strategy, How It Works: Detailed Explanation
The "PresentTrend RMI Synergy Strategy" intricately combines the Relative Momentum Index (RMI) and a custom SuperTrend indicator to create a powerful tool for traders.
🔶 Relative Momentum Index (RMI)
The RMI is a variation of the Relative Strength Index (RSI), but instead of using price closes against itself, it measures the momentum of up and down movements in price relative to previous prices over a given period. The RMI for a period length `N` is calculated as follows:
RMI = 100 - 100/ (1 + U/D)
where:
- `U` is the average upward price change over `N` periods,
- `D` is the average downward price change over `N` periods.
The RMI oscillates between 0 and 100, with higher values indicating stronger upward momentum and lower values suggesting stronger downward momentum.
RMI = 21
RMI = 42
For more information - RMI Trend Sync - Strategy :
🔶 presentTrend Indicator
The presentTrend indicator combines the Average True Range (ATR) with a moving average to determine trend direction and dynamic support or resistance levels. The presentTrend for a period length `M` and a multiplier `F` is defined as:
- Upper Band: MA + (ATR x F)
- Lower Band: MA - (ATR x F)
where:
- `MA` is the moving average of the close price over `M` periods,
- `ATR` is the Average True Range over the same period,
- `F` is the multiplier to adjust the sensitivity.
The trend direction switches when the price crosses the presentTrend bands, signaling potential entry or exit points.
presentTrend length = 3
presentTrend length = 10
For more information - PresentTrend - Strategy :
🔶 Strategy Logic
Entry Conditions:
- Long Entry: Triggered when the RMI exceeds a threshold, say 60, indicating a strong bullish momentum, and when the price is above the presentTrend, confirming an uptrend.
- Short Entry: Occurs when the RMI drops below a threshold, say 40, showing strong bearish momentum, and the price is below the present trend, indicating a downtrend.
Exit Conditions with Dynamic Trailing Stop:
- Long Exit: Initiated when the price crosses below the lower presentTrend band or when the RMI falls back towards a neutral level, suggesting a weakening of the bullish momentum.
- Short Exit: Executed when the price crosses above the upper presentTrend band or when the RMI rises towards a neutral level, indicating a reduction in bearish momentum.
Equations for Dynamic Trailing Stop:
- For Long Positions: The exit price is set at the lower SuperTrend band once the entry condition is met.
- For Short Positions: The exit price is determined by the upper SuperTrend band post-entry.
These dynamic trailing stops adjust as the market moves, providing a method to lock in profits while allowing room for the position to grow.
This strategy's strength lies in its dual analysis approach, leveraging RMI for momentum insights and presentTrend for trend direction and dynamic stops. This combination offers traders a robust framework to navigate various market conditions, aiming to capture trends early and exit positions strategically to maximize gains and minimize losses.
█ Trade Direction
The strategy provides flexibility in trade direction selection, offering "Long," "Short," or "Both" options to cater to different market conditions and trader preferences. This adaptability ensures that traders can align the strategy with their market outlook, risk tolerance, and trading goals.
█ Usage
To utilize the "PresentTrend RMI Synergy Strategy," traders should input their preferred settings in the Pine Script™ and apply the strategy to their charts. Monitoring RMI for momentum shifts and adjusting positions based on SuperTrend signals can optimize entry and exit points, enhancing potential returns while managing risk.
█ Default Settings
1. RMI Length: 21
The 21-period RMI length strikes a balance between capturing momentum and filtering out market noise, offering a medium-term outlook on market trends.
2. Super Trend Length: 7
A SuperTrend length of 7 periods is chosen for its responsiveness to price movements, providing a dynamic framework for trend identification without excessive sensitivity.
3. Super Trend Multiplier: 4.0
The multiplier of 4.0 for the SuperTrend indicator widens the trend bands, focusing on significant market moves and reducing the impact of minor fluctuations.
---
The "PresentTrend RMI Synergy Strategy" represents a significant step forward in trading strategy development, blending momentum and trend analysis in a unique way. By providing a detailed framework for understanding market dynamics, this strategy empowers traders to make more informed decisions.

AI SuperTrend x Pivot Percentile - Strategy [PresentTrading]█ Introduction and How it is Different
The AI SuperTrend x Pivot Percentile strategy is a sophisticated trading approach that integrates AI-driven analysis with traditional technical indicators. Combining the AI SuperTrend with the Pivot Percentile strategy highlights several key advantages:
1. Enhanced Accuracy in Trend Prediction: The AI SuperTrend utilizes K-Nearest Neighbors (KNN) algorithm for trend prediction, improving accuracy by considering historical data patterns. This is complemented by the Pivot Percentile analysis which provides additional context on trend strength.
2. Comprehensive Market Analysis: The integration offers a multi-faceted approach to market analysis, combining AI insights with traditional technical indicators. This dual approach captures a broader range of market dynamics.
BTC 6H L/S Performance
Local
█ Strategy: How it Works - Detailed Explanation
🔶 AI-Enhanced SuperTrend Indicators
1. SuperTrend Calculation:
- The SuperTrend indicator is calculated using a moving average and the Average True Range (ATR). The basic formula is:
- Upper Band = Moving Average + (Multiplier × ATR)
- Lower Band = Moving Average - (Multiplier × ATR)
- The moving average type (SMA, EMA, WMA, RMA, VWMA) and the length of the moving average and ATR are adjustable parameters.
- The direction of the trend is determined based on the position of the closing price in relation to these bands.
2. AI Integration with K-Nearest Neighbors (KNN):
- The KNN algorithm is applied to predict trend direction. It uses historical price data and SuperTrend values to classify the current trend as bullish or bearish.
- The algorithm calculates the 'distance' between the current data point and historical points. The 'k' nearest data points (neighbors) are identified based on this distance.
- A weighted average of these neighbors' trends (bullish or bearish) is calculated to predict the current trend.
For more please check: Multi-TF AI SuperTrend with ADX - Strategy
🔶 Pivot Percentile Analysis
1. Percentile Calculation:
- This involves calculating the percentile ranks for high and low prices over a set of predefined lengths.
- The percentile function is typically defined as:
- Percentile = Value at (P/100) × (N + 1)th position
- Where P is the desired percentile, and N is the number of data points.
2. Trend Strength Evaluation:
- The calculated percentiles for highs and lows are used to determine the strength of bullish and bearish trends.
- For instance, a high percentile rank in the high prices may indicate a strong bullish trend, and vice versa for bearish trends.
For more please check: Pivot Percentile Trend - Strategy
🔶 Strategy Integration
1. Combining SuperTrend and Pivot Percentile:
- The strategy synthesizes the insights from both AI-enhanced SuperTrend and Pivot Percentile analysis.
- It compares the trend direction indicated by the SuperTrend with the strength of the trend as suggested by the Pivot Percentile analysis.
2. Signal Generation:
- A trading signal is generated when both the AI-enhanced SuperTrend and the Pivot Percentile analysis agree on the trend direction.
- For instance, a bullish signal is generated when both the SuperTrend is bullish, and the Pivot Percentile analysis shows strength in bullish trends.
🔶 Risk Management and Filters
- ADX and DMI Filter: The strategy uses the Average Directional Index (ADX) and the Directional Movement Index (DMI) as filters to assess the trend's strength and direction.
- Dynamic Trailing Stop Loss: Based on the SuperTrend indicator, the strategy dynamically adjusts stop-loss levels to manage risk effectively.
This strategy stands out for its ability to combine real-time AI analysis with established technical indicators, offering traders a nuanced and responsive tool for navigating complex market conditions. The equations and algorithms involved are pivotal in accurately identifying market trends and potential trade opportunities.
█ Usage
To effectively use this strategy, traders should:
1. Understand the AI and Pivot Percentile Indicators: A clear grasp of how these indicators work will enable traders to make informed decisions.
2. Interpret the Signals Accurately: The strategy provides bullish, bearish, and neutral signals. Traders should align these signals with their market analysis and trading goals.
3. Monitor Market Conditions: Given that this strategy is sensitive to market dynamics, continuous monitoring is crucial for timely decision-making.
4. Adjust Settings as Needed: Traders should feel free to tweak the input parameters to suit their trading preferences and to respond to changing market conditions.
█Default Settings and Their Impact on Performance
1. Trading Direction (Default: "Both")
Effect: Determines whether the strategy will take long positions, short positions, or both. Adjusting this setting can align the strategy with the trader's market outlook or risk preference.
2. AI Settings (Neighbors: 3, Data Points: 24)
Neighbors: The number of nearest neighbors in the KNN algorithm. A higher number might smooth out noise but could miss subtle, recent changes. A lower number makes the model more sensitive to recent data but may increase noise.
Data Points: Defines the amount of historical data considered. More data points provide a broader context but may dilute recent trends' impact.
3. SuperTrend Settings (Length: 10, Factor: 3.0, MA Source: "WMA")
Length: Affects the sensitivity of the SuperTrend indicator. A longer length results in a smoother, less sensitive indicator, ideal for long-term trends.
Factor: Determines the bandwidth of the SuperTrend. A higher factor creates wider bands, capturing larger price movements but potentially missing short-term signals.
MA Source: The type of moving average used (e.g., WMA - Weighted Moving Average). Different MA types can affect the trend indicator's responsiveness and smoothness.
4. AI Trend Prediction Settings (Price Trend: 10, Prediction Trend: 80)
Price Trend and Prediction Trend Lengths: These settings define the lengths of weighted moving averages for price and SuperTrend, impacting the responsiveness and smoothness of the AI's trend predictions.
5. Pivot Percentile Settings (Length: 10)
Length: Influences the calculation of pivot percentiles. A shorter length makes the percentile more responsive to recent price changes, while a longer length offers a broader view of price trends.
6. ADX and DMI Settings (ADX Length: 14, Time Frame: 'D')
ADX Length: Defines the period for the Average Directional Index calculation. A longer period results in a smoother ADX line.
Time Frame: Sets the time frame for the ADX and DMI calculations, affecting the sensitivity to market changes.
7. Commission, Slippage, and Initial Capital
These settings relate to transaction costs and initial investment, directly impacting net profitability and strategy feasibility.

QQE MOD + SSL Hybrid + Waddah Attar Explosion IndicatorINDICATOR PURPOSE
This indicator is designed to complement my original QQE MOD + SSL Hybrid + Waddah Attar Explosion strategy.
Multiple users have requested that I convert the strategy to an indicator because alertconditions do not work on strategies and people want to specific set alerts for BUY, SELL, CLOSE BUY and CLOSE SELL. This can only be achieved using alertcondition().
This indicator functions in the exact same way as the strategy, but it doesn't have any backtesting functionality. I recomment that you use the original QQE MOD + SSL Hybrid + Waddah Attar Explosion strategy for parameter tuning and backtesting, then if you need more control on alerts you can use this indicator for that purpose.
Only other difference is that I have added grey exit labels on the chart since it's not obvious where the exits would happen like it was in the strategy version.
CREDITS
QQE MOD byMihkel00
SSL Hybrid by Mihkel00
Waddah Attar Explosion by shayankm

Turtle Trader StrategyTurtle Trader Strategy :
Introduction :
This strategy is based on the well known « Turtle Trader Strategy », that has proven itself over the years. It sends long and short signals with pyramid orders of up to 5, meaning that the strategy can trigger up to 5 orders in the same direction. Good risk and money management.
It's important to note that the strategy combines 2 systems working together (S1 and S2). Let’s describe the specific features of this strategy.
1/ Position size :
Position size is very important for turtle traders to manage risk properly. This position sizing strategy adapts to market volatility and to account (gains and losses). It’s based on ATR (Average True Range) which can also be called « N ». Its length is per default 20.
ATR(20) = (previous_atr(20)*19 + actual_true_range)/20
The number of units to buy is :
Unit = 1% * account/(ATR(20)*dollar_per_point)
where account is the actual account value and dollar_per_point is the variation in dollar of the asset with a 1 point move.
Depending on your risk aversion, you can increase the percentage of your account, but turtle traders default to 1%. If you trade contracts, units must be rounded down by default.
There is also an additional rule to reduce the risk if the value of the account falls below the initial capital : in this case and only in this case, account in the unit formula must be replace by :
account = actual_account*actual_account/initial capital
2/ Open a position :
2 systems are working together :
System 1 : Entering a new 20 day breakout
System 2 : Entering a new 55 day breakout
A breakout is a new high or new low. If it’s a new high, we open long position and vice versa if it’s a new low we enter in short position.
We add an additional rule :
System 1 : Breakout is ignored if last long/short position was a winner
System 2 : All signals are taken
This additional rule allows the trader to be in the major trends if the system 1 signal has been skipped. If a signal for system 1 has been skipped, and next candle is also a new 20 day breakout, S1 doesn’t give a signal. We have to wait S2 signal or wait for a candle that doesn’t make a new breakout to reactivate S1.
3/ Pyramid orders :
Turtle Strategy allows us to add extra units to the position if the price moves in our favor. I've configured the strategy to allow up to 5 orders to be added in the same direction. So if the price varies from 0.5*ATR(20) , we add units with the position size formula. Note that the value of account will be replaced by "remaining_account", i.e. the cash remaining in our account after subtracting the value of open positions.
4/ Stop Loss :
We set a stop loss at 1.5*ATR(20) below the entry price for longs and above the entry price for shorts. If pyramid units are added, the stop is increased/decreased by 0.5*ATR(20). Note that if SL is configured for a loss of more than 10%, we set the SL to 10% for the first entry order to avoid big losses. This configuration does not work for pyramid orders as SL moves by 0.5*ATR(20).
5/ Exit signals :
System 1 :
Exit long on a 10 day low
Exit short on a 10 day high
System 2 :
Exit long on a 20 day low
Exit short on a 20 day high
6/ What types of orders are placed ?
To enter in a position, stop orders are placed meaning that we place orders that will be automatically triggered by the signal at the exact breakout price. Stop loss and exit signals are also stop orders. Pyramid orders are market orders which will be triggered at the opening of the next candle to avoid repainting.
PARAMETERS :
Risk % of capital : Percentage used in the position size formula. Default is 1%
ATR period : ATR length used to calculate ATR. Default is 20
Stop ATR : Parameters used to fix stop loss. Default is 1.5 meaning that stop loss will be set at : buy_price - 1.5*ATR(20) for long and buy_price + 1.5*ATR(20) for short. Turtle traders default is 2 but 1.5 is better for cryptocurrency as there is a huge volatility.
S1 Long : System 1 breakout length for long. Default is 20
S2 Long : System 2 breakout length for long. Default is 55
S1 Long Exit : System 1 breakout length to exit long. Default is 10
S2 Long Exit : System 2 breakout length to exit long. Default is 20
S1 Short : System 1 breakout length for short. Default is 15
S2 Short : System 2 breakout length for short. Default is 55
S1 Short Exit : System 1 breakout length to exit short. Default is 7
S2 Short Exit : System 2 breakout length to exit short. Default is 20
Initial capital : $1000
Fees : Interactive Broker fees apply to this strategy. They are set at 0.18% of the trade value.
Slippage : 3 ticks or $0.03 per trade. Corresponds to the latency time between the moment the signal is received and the moment the order is executed by the broker.
Pyramiding : Number of orders that can be passed in the same direction. Default is 5.
Important : Turtle traders don't trade crypto. For this specific asset type, I modify some parameters such as SL and Short S1 in order to maximize return while limiting drawdown. This strategy is the most optimal on BINANCE:BTCUSD in 1D timeframe with the parameters set per default. If you want to use this strategy for a different crypto please adapt parameters.
NOTE :
It's important to note that the first entry order (long or short) will be the largest. Subsequent pyramid orders will have fewer units than the first order. We've set a maximum SL for the first order of 10%, meaning that you won't lose more than 10% of the value of your first order. However, it is possible to lose more on your pyramid orders, as the SL is increased/decreased by 0.5*ATR(20), which does not secure a loss of more than 10% on your pyramid orders. The risk remains well managed because the value of these orders is less than the value of the first order. Remain vigilant to this small detail and adjust your risk according to your risk aversion.
Enjoy the strategy and don’t forget to take the trade :)

FlexiMA x FlexiST - Strategy [presentTrading]█ Introduction and How it is Different
The FlexiMA x FlexiST Strategy blends two analytical methods - FlexiMA and FlexiST, which are opened in my early post.
- FlexiMA calculates deviations between an indicator source and a dynamic moving average, controlled by a starting factor and increment factor.
- FlexiST, on the other hand, leverages the SuperTrend model, adjusting the Average True Range (ATR) length for a comprehensive trend-following oscillator.
This synergy offers traders a more nuanced and multifaceted tool for market analysis.
BTC 6H L/S Performance
Local
█ Strategy, How It Works: Detailed Explanation
The strategy combines two components: FlexiMA and FlexiST, each utilizing unique methodologies to analyze market trends.
🔶FlexiMA Component:
- Calculates deviations between an indicator source and moving averages of variable lengths.
- Moving average lengths are dynamically adjusted using a starting factor and increment factor.
- Deviations are normalized and analyzed to produce median and standard deviation values, forming the FlexiMA oscillator.
Length indicator (50)
🔶FlexiST Component:
- Uses SuperTrend indicators with varying ATR (Average True Range) lengths.
- Trends are identified based on the position of the indicator source relative to the SuperTrend bands.
- Deviations between the indicator source and SuperTrend values are calculated and normalized.
Starting Factor (5)
🔶Combined Strategy Logic:
- Entry Signals:
- Long Entry: Triggered when median values of both FlexiMA and FlexiST are positive.
- Short Entry: Triggered when median values of both FlexiMA and FlexiST are negative.
- Exit Signals:
- Long Exit: Triggered when median values of FlexiMA or FlexiST turn negative.
- Short Exit: Triggered when median values of FlexiMA or FlexiST turn positive.
This strategic blend of FlexiMA and FlexiST allows for a nuanced analysis of market trends, providing traders with signals based on a comprehensive view of market momentum and trend strength.
█ Trade Direction
The strategy is designed to cater to various trading preferences, offering "Long", "Short", and "Both" options. This flexibility allows traders to align the strategy with their specific market outlook, be it bullish, bearish, or a combination of both.
█ Usage
Traders can effectively utilize the FlexiMA x FlexiST Strategy by first selecting their desired trade direction. The strategy then generates entry signals when the conditions for either the FlexiMA or FlexiST are met, indicating potential entry points in the market. Conversely, exit signals are generated when the conditions for these indicators diverge, thus signaling a potential shift in market trends and suggesting a strategic exit point.
█ Default Settings
1. Indicator Source (HLC3): Provides a balanced and stable price source, reducing the impact of extreme market fluctuations.
2. Indicator Lengths (20 for FlexiMA, 10 for FlexiST): Longer FlexiMA length smooths out short-term fluctuations, while shorter FlexiST length allows for quicker response to market changes.
3. Starting Factors (1.0 for FlexiMA, 0.618 for FlexiST): Balanced start for FlexiMA and a harmonized approach for FlexiST, resonating with natural market cycles.
4. Increment Factors (1.0 for FlexiMA, 0.382 for FlexiST): FlexiMA captures a wide range of market behaviors, while FlexiST provides a gradual transition to capture finer trend shifts.
5. Normalization Methods ('None'): Uses raw deviations, suitable for markets where absolute price movements are more significant.
6. Trade Direction ('Both'): Allows strategy to consider both long and short opportunities, ideal for versatile market engagement.
*More details:
1. FlexiMA
2. FlexiST

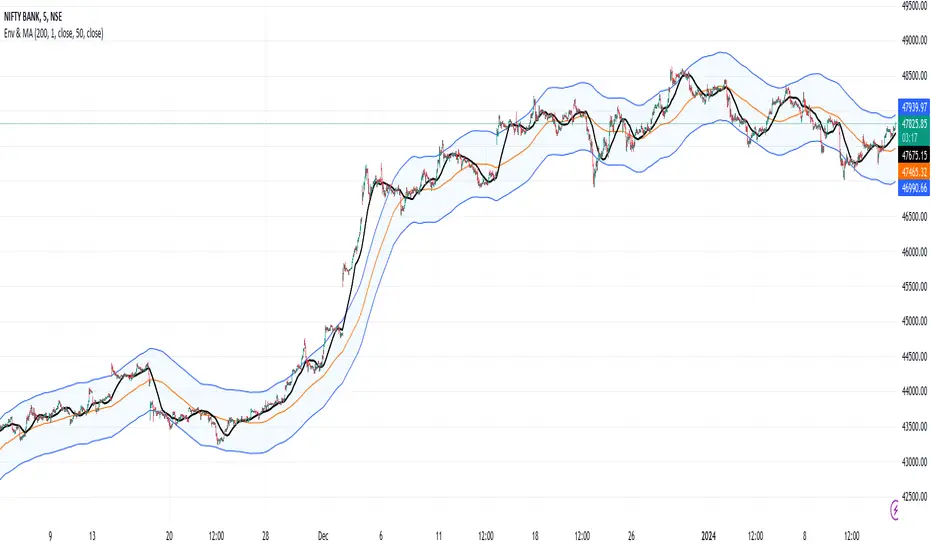
Envelope and Moving Average**Description:**
- This script creates an indicator that combines an envelope and a simple moving average (MA).
- The envelope is constructed using a specified length, percentage deviation, and source price (close by default).
- The moving average is calculated based on a specified length and source price.
**Inputs:**
1. Envelope:
- Length: Number of periods used for the envelope calculation (default is 20).
- Percentage Deviation: Percentage above and below the envelope basis (default is 10%).
- Source: The price used for the envelope calculation (default is close).
- Exponential MA: Option to use exponential moving average for the envelope basis (default is false).
2. Moving Average:
- Length: Number of periods used for the moving average calculation (default is 20).
- Source: The price used for the moving average calculation (default is close).
**Plotting:**
- The script plots the envelope basis, upper envelope line, and lower envelope line.
- The area between the upper and lower envelope lines is filled with a semi-transparent color for better visualization.
- The moving average is plotted on the chart with a specified color and line width.
**How to Use in a Strategy:**
1. **Envelope Crossovers:**
- Go Long (Buy): When the close price crosses above the upper envelope line.
- Go Short (Sell): When the close price crosses below the lower envelope line.
2. **Moving Average Crossovers:**
- Go Long (Buy): When the close price crosses above the moving average.
- Go Short (Sell): When the close price crosses below the moving average.
3. **Confirmation:**
- Consider additional confirmation signals or filters to improve the robustness of your strategy.
- For example, you might require a certain amount of price momentum or use other technical indicators in conjunction with envelope and moving average signals.
4. **Optimization:**
- Experiment with different parameter values (e.g., envelope length, percentage deviation, moving average length) to optimize the strategy for specific market conditions.
5. **Risk Management:**
- Implement proper risk management techniques, such as setting stop-loss orders and position sizing, to control risk.
Remember to thoroughly backtest any strategy before deploying it in a live trading environment. Additionally, consider the current market conditions and adapt your strategy accordingly.
Megabar Breakout (Range & Volume & RSI)Hey there,
This strategy is based on the idea that certain events lead to what are called Megabars. Megabars are bars that have a very large range and volume. I wanted to verify whether these bars indicate the start of a trend and whether one should follow the trend.
Summary of the Code:
The code is based on three indicators: the range of the bar, the volume of the bar, and the RSI. When certain values of these indicators are met, a Megabar is identified. The direction of the Megabar indicates the direction in which we should trade.
Why do I combine these indicators?
I want to identify special bars that have the potential to mark the beginning of a breakout. Therefore, a bar needs to exhibit high volume, have a large range (huge price movement), and we also use the Relative Strength Index (RSI) to assess potential momentum. Only if all three criteria are met within one candle, do we use this as an identifier for a megabar.
Explanation of Drawings on the Chart:
As you can see, there is a green background on my chart. The green background symbolizes the time when I'm entering a trade. Only if a Megabar happens during that time, I'm ready to enter a trade. The time is between 6 AM and 4 PM CET. It's just because I prefer that time. Also, the strategy draws an error every time a Megabar happens based on VOL and Range only (not on the RSI). That makes it pretty easy to go through your chart and check the biggest bars manually. You can activate or deactivate these settings via the input data of the strategy.
When Do We Enter a Trade?
We wait for a Megabar to happen during our trading session. If the Megabar is bullish, we open a LONG trade at the opening price of the next candle. If the Megabar is bearish, we open a SHORT trade at the opening price of the next candle.
Where Do We Put Our Take Profit & Stop Loss?
The default setting is TP = 40 Pips and SL = 30 Pips. In that case, we are always trading with a risk-reward ratio of 1.33 by default. You can easily change these settings via the input data of the strategy.
Strategy Results
The criteria for Megabars were chosen by me in a way that makes Megabars something special. They are not intended to occur too frequently, as the fundamental idea of this strategy would otherwise not hold. This results in only 37 closed trades within the last 12 months. If you change the criterias for a megabar to a milder one, you will create more Megabars and therefore more trades. It's up to you. I have adapted this strategy to the 30-minute chart of the EURUSD. In the evaluation, we consider a period of 12 months, which I believe is sufficient.
My default settings for the indicators look like this:
Avg Length Vol 20
Avg Multiplier Vol 3
Avg Length Range 20
Avg Multiplier Range 4
Value SMA RSI for Long Trades 50
Value SMA RSI for Short Trades 70
IMPORTANT: The current performance overview does not display the results of these settings. Please change the settings to my default ones so that you can see how I use this strategy.
I do not recommend trading this strategy without further testing. The script is meant to reflect a basic idea and be used as a tool to identify Megabars. I have made this strategy completely public so that it can be further developed. One can take this framework and test it on different timeframes and different markets.

Mean Reversion with Incremental Entry by HedgerLabsThe "Mean Reversion with Incremental Entry" strategy, designed by HedgerLabs, is an advanced TradingView strategy script focusing on the mean reversion technique in financial markets. This strategy is engineered for traders who prefer a systematic approach with an emphasis on incremental entries based on price movements relative to a moving average.
Key Features:
Moving Average Based Strategy: Central to this strategy is the simple moving average (SMA), around which all trade entries and exits revolve. Traders can customize the MA length, making it flexible for various trading styles and timeframes.
Incremental Entry Mechanism: Unique to this strategy is the incremental entry system. The strategy initiates an initial trade when the price deviates from the MA by a specified percentage. Subsequent entries are made at incremental steps, defined by the trader, as the price moves further away from the MA. This method can potentially capitalize on increasing market volatility.
Dynamic Position Management: The strategy intelligently manages positions by entering long when the price is below the MA and short when above, allowing for adaptive positioning in different market conditions.
Automated Exit Logic: Exit points are determined when the price touches the MA, aiming to close positions at potential reversal points for optimized trade outcomes.
Continuous Market Analysis: With 'calc_on_every_tick' enabled, the strategy constantly evaluates market conditions, ensuring prompt reaction to price movements.
Usage Scenario:
This strategy is particularly beneficial in markets exhibiting mean-reverting behavior. It is suitable for traders focusing on swing trading or those who prefer to scale into positions during periods of high volatility.
Disclaimer:
Please remember that this strategy is for informational and educational purposes only and is not intended as financial or investment advice. Trading in financial markets carries risks, including the potential loss of capital. We advise doing your own research and consulting with a financial expert before making any investment decisions.

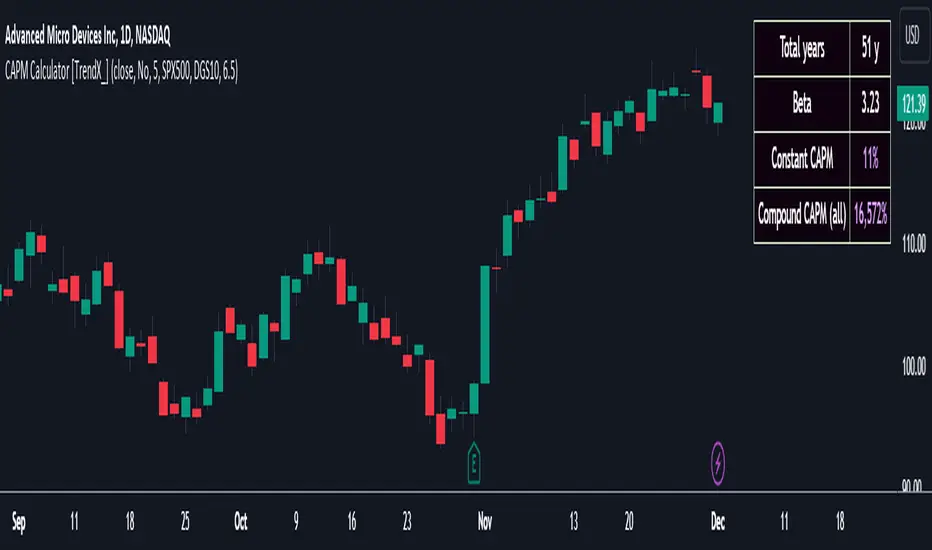
CAPM Calculator [TrendX_]CAPM calculator is a powerful tool that helps find the cost of equity, which is the minimum return that shareholders require to invest in a company.
With the CAPM calculator, you can assess how well your trading strategy performs compared to the market. The goal of your strategy is to earn higher returns than what you would get by investing in the market with the same level of risk. This is called the risk-adjusted cost of capital, and it represents the minimum return that you should accept for your investment.
USAGE
A simple way to measure this is to compare the Compound annual growth rate (CAGR) of the trading strategy with the “Compound CAPM”, which is the CAGR of investing in the market with the same beta as the strategy.
If the trading strategy has a higher CAGR than the “Compound CAPM”, it means that it has outperformed the market on a risk-adjusted basis.
This is a sign of an effective trading strategy.
DISCLAIMER
The results achieved in the past are not all reliable sources of what will happen in the future. There are many factors and uncertainties that can affect the outcome of any endeavor, and no one can guarantee or predict with certainty what will occur.
Therefore, you should always exercise caution and judgment when making decisions based on past performance.
London BreakOut ClassicHey there, this is my first time publishing a strategy. The strategy is based on the London Breakout Idea, an incredibly popular concept with abundant information available online.
Let me summarize the London Breakout Strategy in a nutshell: It involves identifying key price levels based on the Tokyo Session before the London Session starts. Typically, these key levels are the high and low of the previous Tokyo session. If a breakout occurs during the London session, you simply follow the trend.
The purpose of this code
After conducting my research, I came across numerous posts, videos, and articles discussing the London Breakout Strategy. I aimed to automatically test it myself to verify whether the claims made by these so-called trading gurus are accurate or not. Consequently, I wrote this script to gain an understanding of how this strategy would perform if I were to follow its basic settings blindly.
Explanation of drawings on the chart:
Red or Green Box: A box is drawn on our chart displaying the exact range of the Tokyo trading session. This box is colored red if the trend during the session was downward and green if it was upward. The box is always drawn between the high and the low between 0:00 AM and 7:00 AM UTC. You can change the settings via the Inputs "Session time Tokyo" & "Session time zone".
Green Background: The green background represents the London trading session. My code allows us to make entries only during this time. If we haven't entered a trade, any pending orders are canceled. I've also programmed a timeout at 11 pm to ensure every trade is closed before the new Tokyo session begins.
Red Line: The red line is automatically placed in the middle of our previous Tokyo range. This line acts as our stop loss. If we cross this line after entering a trade but before reaching our take profit, we'll be stopped out.
When do we enter a trade?
We wait for a candle body to close outside of the previous Tokyo range to enter a trade with the opening of the next candle. We only enter one trade per day.
Where do we put our Take Profit?
The code calculates the exact distance between our entry point and the stop loss. We are trading a risk-reward ratio of 1:1 by default, meaning our take profit is always the same number of pips away from our entry as the stop loss. The Stop Loss is always defined by the red line on the chart. You can change the risk-reward ratio via the inputs setting "CRV", to see how the result changes.
What is the purpose of this script?
I wanted to backtest the London breakout strategy to see how it actually works. Therefore, I wrote this code so that everybody can test it for themselves. You can change the settings and see how the result changes. Typically, you should test this strategy on forex markets and on either 1Min, 5 Min, or 15 Min timeframe.
What are the results?
Over the last 3-6 months (over 100 trades), trading the strategy with my default settings hasn't proven to be very successful. Consequently, I do not recommend trading this strategy blindly. The purpose of this code is to provide you with a foundation for the London Breakout Strategy, allowing you to modify and enhance it according to your preferences. If you're contemplating whether to give it a try, you can assess the results from the past months by using this code as a starting point.

MACD of Relative Strenght StrategyMACD Relative Strenght Strategy :
INTRODUCTION :
This strategy is based on two well-known indicators: MACD and Relative Strenght (RS). By coupling them, we obtain powerful buy signals. In fact, the special feature of this strategy is that it creates an indicator from an indicator. Thus, we construct a MACD whose source is the value of the RS. The strategy only takes buy signals, ignoring SHORT signals as they are mostly losers. There's also a money management method enabling us to reinvest part of the profits or reduce the size of orders in the event of substantial losses.
RELATIVE STRENGHT :
RS is an indicator that measures the anomaly between momentum and the assumption of market efficiency. It is used by professionals and is one of the most robust indicators. The idea is to own assets that do better than average, based on their past performance. We calculate RS using this formula :
RS = close/highest_high(RS_Length)
Where highest_high(RS_Length) = highest value of the high over a user-defined time period (which is the RS_Length).
We can thus situate the current price in relation to its highest price over this user-defined period.
MACD (Moving Average Convergence - Divergence) :
This is one of the best-known indicators, measuring the distance between two exponential moving averages : one fast and one slower. A wide distance indicates fast momentum and vice versa. We'll plot the value of this distance and call this line macdline. The MACD uses a third moving average with a lower period than the first two. This last moving average will give a signal when it crosses the macdline. It is therefore constructed using the values of the macdline as its source.
It's important to note that the first two MAs are constructed using RS values as their source. So we've just built an indicator of an indicator. This kind of method is very powerful because it is rarely used and brings value to the strategy.
PARAMETERS :
RS Length : Relative Strength length i.e. the number of candles back to find the highest high and compare the current price with this high. Default is 300.
MACD Fast Length : Relative Strength fast EMA length used to plot the MACD. Default is 14.
MACD Slow Length : Relative Strength slow EMA length used to plot the MACD. Default is 26.
MACD Signal Smoothing : Macdline SMA length used to plot the MACD. Default is 10.
Max risk per trade (in %) : The maximum loss a trade can incur (in percentage of the trade value). Default is 8%.
Fixed Ratio : This is the amount of gain or loss at which the order quantity is changed. Default is 400, meaning that for each $400 gain or loss, the order size is increased or decreased by a user-selected amount.
Increasing Order Amount : This is the amount to be added to or subtracted from orders when the fixed ratio is reached. The default is $200, which means that for every $400 gain, $200 is reinvested in the strategy. On the other hand, for every $400 loss, the order size is reduced by $200.
Initial capital : $1000
Fees : Interactive Broker fees apply to this strategy. They are set at 0.18% of the trade value.
Slippage : 3 ticks or $0.03 per trade. Corresponds to the latency time between the moment the signal is received and the moment the order is executed by the broker.
Important : A bot has been used to test the different parameters and determine which ones maximize return while limiting drawdown. This strategy is the most optimal on BITSTAMP:ETHUSD in 8h timeframe with the parameters set by default.
ENTER RULES :
The entry rules are very simple : we open a long position when the MACD value turns positive. You are therefore LONG when the MACD is green.
EXIT RULES :
We exit a position (whether losing or winning) when the MACD becomes negative, i.e. turns red.
RISK MANAGEMENT :
This strategy can incur losses, so it's important to manage our risks well. If the position is losing and has incurred a loss of -8%, our stop loss is activated to limit losses.
MONEY MANAGEMENT :
The fixed ratio method was used to manage our gains and losses. For each gain of an amount equal to the value of the fixed ratio, we increase the order size by a value defined by the user in the "Increasing order amount" parameter. Similarly, each time we lose an amount equal to the value of the fixed ratio, we decrease the order size by the same user-defined value. This strategy increases both performance and drawdown.
Enjoy the strategy and don't forget to take the trade :)

RMI Trend Sync - Strategy [presentTrading]█ Introduction and How It Is Different
The "RMI Trend Sync - Strategy " combines the strength of the Relative Momentum Index (RMI) with the dynamic nature of the Supertrend indicator. This strategy diverges from traditional methodologies by incorporating a dual analytical framework, leveraging both momentum and trend indicators to offer a more holistic market perspective. The integration of the RMI provides an enhanced understanding of market momentum, while the Super Trend indicator offers clear insights into the end of market trends, making this strategy particularly effective in diverse market conditions.
BTC 4h long/short performance
█ Strategy: How It Works - Detailed Explanation
- Understanding the Relative Momentum Index (RMI)
The Relative Momentum Index (RMI) is an adaptation of the traditional Relative Strength Index (RSI), designed to measure the momentum of price movements over a specified period. While RSI focuses on the speed and change of price movements, RMI incorporates the direction and magnitude of those movements, offering a more nuanced view of market momentum.
- Principle of RMI
Calculation Method: RMI is calculated by first determining the average gain and average loss over a given period (Length). It differs from RSI in that it uses the price change (close-to-close) rather than absolute gains or losses. The average gain is divided by the average loss, and this ratio is then normalized to fit within a 0-100 scale.
- Momentum Analysis in the Strategy
Thresholds for Decision Making: The strategy uses predetermined thresholds (pmom for positive momentum and nmom for negative momentum) to trigger trading decisions. When RMI crosses above the positive threshold and other conditions align (e.g., a bullish trend), it signals a potential long entry. Similarly, crossing below the negative threshold in a bearish trend may trigger a short entry.
- Super Trend and Trend Analysis
The Super Trend indicator is calculated based on a higher time frame, providing a broader view of the market trend. This indicator uses the Average True Range (ATR) to adapt to market volatility, making it an effective tool for identifying trend reversals.
The strategy employs a Volume Weighted Moving Average (VWMA) alongside the Super Trend, enhancing its capability to identify significant trend shifts.
ETH 4hr long/short performance
█ Trade Direction
The strategy offers flexibility in selecting the trading direction: long, short, or both. This versatility allows traders to adapt to their market outlook and risk tolerance, whether looking to capitalize on bullish trends, bearish trends, or a combination of both.
█ Usage
To effectively use the "RMI Trend Sync" strategy, traders should first set their preferred trading direction and adjust the RMI and Super Trend parameters according to their risk appetite and trading goals.
The strategy is designed to adapt to various market conditions, making it suitable for different asset classes and time frames.
█ Default Settings
RMI Settings: Length: 21, Positive Momentum Threshold: 70, Negative Momentum Threshold: 30
Super Trend Settings: Length: 10, Higher Time Frame: 480 minutes, Super Trend Factor: 3.5, MA Source: WMA
Visual Settings: Display Range MA: True, Bullish Color: #00bcd4, Bearish Color: #ff5252
Additional Settings: Band Length: 30, RWMA Length: 20

Bollinger Bands StrategyBollinger Bands Strategy :
INTRODUCTION :
This strategy is based on the famous Bollinger Bands. These are constructed using a standard moving average (SMA) and the standard deviation of past prices. The theory goes that 90% of the time, the price is contained between these two bands. If it were to break out, this would mean either a reversal or a continuation. However, when a reversal occurs, the movement is weak, whereas when a continuation occurs, the movement is substantial and profits can be interesting. We're going to use BB to take advantage of this strong upcoming movement, while managing our risks reasonably. There's also a money management method for reinvesting part of the profits or reducing the size of orders in the event of substantial losses.
BOLLINGER BANDS :
The construction of Bollinger bands is straightforward. First, plot the SMA of the price, with a length specified by the user. Then calculate the standard deviation to measure price dispersion in relation to the mean, using this formula :
stdv = (((P1 - avg)^2 + (P2 - avg)^2 + ... + (Pn - avg)^2) / n)^1/2
To plot the two Bollinger bands, we then add a user-defined number of standard deviations to the initial SMA. The default is to add 2. The result is :
Upper_band = SMA + 2*stdv
Lower_band = SMA - 2*stdv
When the price leaves this channel defined by the bands, we obtain buy and sell signals.
PARAMETERS :
BB Length : This is the length of the Bollinger Bands, i.e. the length of the SMA used to plot the bands, and the length of the price series used to calculate the standard deviation. The default is 120.
Standard Deviation Multipler : adds or subtracts this number of times the standard deviation from the initial SMA. Default is 2.
SMA Exit Signal Length : Exit signals for winning and losing trades are triggered by another SMA. This parameter defines the length of this SMA. The default is 110.
Max Risk per trade (in %) : It's the maximum percentage the user can lose in one trade. The default is 6%.
Fixed Ratio : This is the amount of gain or loss at which the order quantity is changed. The default is 400, meaning that for each $400 gain or loss, the order size is increased or decreased by a user-selected amount.
Increasing Order Amount : This is the amount to be added to or subtracted from orders when the fixed ratio is reached. The default is $200, which means that for every $400 gain, $200 is reinvested in the strategy. On the other hand, for every $400 loss, the order size is reduced by $200.
Initial capital : $1000
Fees : Interactive Broker fees apply to this strategy. They are set at 0.18% of the trade value.
Slippage : 3 ticks or $0.03 per trade. Corresponds to the latency time between the moment the signal is received and the moment the order is executed by the broker.
Important : A bot has been used to test the different parameters and determine which ones maximize return while limiting drawdown. This strategy is the most optimal on BITSTAMP:BTCUSD in 8h timeframe with the following parameters :
BB Length = 120
Standard Deviation Multipler = 2
SMA Exit Signal Length = 110
Max Risk per trade (in %) = 6%
ENTER RULES :
The entry rules are simple:
If close > Upper_band it's a LONG signal
If close < Lower_band it's a SHORT signal
EXIT RULES :
If we are LONG and close < SMA_EXIT, position is closed
If we are SHORT and close > SMA_EXIT, the position is closed
Positions close automatically if they lose more than 6% to limit risk
RISK MANAGEMENT :
This strategy is subject to losses. We manage our risk using the exit SMA or using a SL sets to 6%. This SMA gives us exit signals when the price closes below or above, thus limiting losses. If the signal arrives too late, the position is closed after a loss of 6%.
MONEY MANAGEMENT :
The fixed ratio method was used to manage our gains and losses. For each gain of an amount equal to the fixed ratio value, we increase the order size by a value defined by the user in the "Increasing order amount" parameter. Similarly, each time we lose an amount equal to the value of the fixed ratio, we decrease the order size by the same user-defined value. This strategy increases both performance and drawdown.
NOTE :
Please note that the strategy is backtested from 2017-01-01. As the timeframe is 8h, this strategy is a medium/long-term strategy. That's why only 51 trades were closed. Be careful, as the test sample is small and performance may not necessarily reflect what may happen in the future.
Enjoy the strategy and don't forget to take the trade :)

Rate of Change StrategyRate of Change Strategy :
INTRODUCTION :
This strategy is based on the Rate of Change indicator. It compares the current price with that of a user-defined period of time ago. This makes it easy to spot trends and even speculative bubbles. The strategy is long term and very risky, which is why we've added a Stop Loss. There's also a money management method that allows you to reinvest part of your profits or reduce the size of your orders in the event of substantial losses.
RATE OF CHANGE (ROC) :
As explained above, the ROC is used to situate the current price compared to that of a certain period of time ago. The formula for calculating ROC in relation to the previous year is as follows :
ROC (365) = (close/close (365) - 1) * 100
With this formula we can find out how many percent the change in the current price is compared with 365 days ago, and thus assess the trend.
PARAMETERS :
ROC Length : Length of the ROC to be calculated. The current price is compared with that of the selected length ago.
ROC Bubble Signal : ROC value indicating that we are in a bubble. This value varies enormously depending on the financial product. For example, in the equity market, a bubble exists when ROC = 40, whereas in cryptocurrencies, a bubble exists when ROC = 150.
Stop Loss (in %) : Stop Loss value in percentage. This is the maximum trade value percentage that can be lost in a single trade.
Fixed Ratio : This is the amount of gain or loss at which the order quantity is changed. The default is 400, which means that for each $400 gain or loss, the order size is increased or decreased by an amount chosen by the user.
Increasing Order Amount : This is the amount to be added to or subtracted from orders when the fixed ratio is reached. The default is $200, which means that for every $400 gain, $200 is reinvested in the strategy. On the other hand, for every $400 loss, the order size is reduced by $200.
Initial capital : $1000
Fees : Interactive Broker fees apply to this strategy. They are set at 0.18% of the trade value.
Slippage : 3 ticks or $0.03 per trade. Corresponds to the latency time between the moment the signal is received and the moment the order is executed by the broker.
Important : A bot has been used to test the different parameters and determine which ones maximize return while limiting drawdown. This strategy is the most optimal on BITSTAMP:BTCUSD in 1D timeframe with the following parameters :
ROC Length = 365
ROC Bubble Signal = 180
Stop Loss (in %) = 6
LONG CONDITION :
We are in a LONG position if ROC (365) > 0 for at least two days. This allows us to limit noise and irrelevant signals to ensure that the ROC remains positive.
SHORT CONDITION :
We are in a SHORT position if ROC (365) < 0 for at least two days. We also open a SHORT position when the speculative bubble is about to burst. If ROC (365) > 180, we're in a bubble. If the bubble has been in existence for at least a week and the ROC falls back below this threshold, we can expect the asset to return to reasonable prices, and thus a downward trend. So we're opening a SHORT position to take advantage of this upcoming decline.
EXIT RULES FOR WINNING TRADE :
The strategy is self-regulating. We don't exit a LONG trade until a SHORT signal has arrived, and vice versa. So, to exit a winning position, you have to wait for the entry signal of the opposite position.
RISK MANAGEMENT :
This strategy is very risky, and we can easily end up on the wrong side of the trade. That's why we're going to manage our risk with a Stop Loss, limiting our losses as a percentage of the trade's value. By default, this percentage is set at 6%. Each trade will therefore take a maximum loss of 6%.
If the SL has been triggered, it probably means we were on the wrong side. This is why we change the direction of the trade when a SL is triggered. For example, if we were SHORT and lost 6% of the trade value, the strategy will close this losing trade and open a long position without taking into account the ROC value. This allows us to be in position all the time and not miss the best opportunities.
MONEY MANAGEMENT :
The fixed ratio method was used to manage our gains and losses. For each gain of an amount equal to the value of the fixed ratio, we increase the order size by a value defined by the user in the "Increasing order amount" parameter. Similarly, each time we lose an amount equal to the value of the fixed ratio, we decrease the order size by the same user-defined value. This strategy increases both performance and drawdown.
NOTE :
Please note that the strategy is backtested from 2017-01-01. As the timeframe is 1D, this strategy is a medium/long-term strategy. That's why only 34 trades were closed. Be careful, as the test sample is small and performance may not necessarily reflect what may happen in the future.
Enjoy the strategy and don't forget to take the trade :)

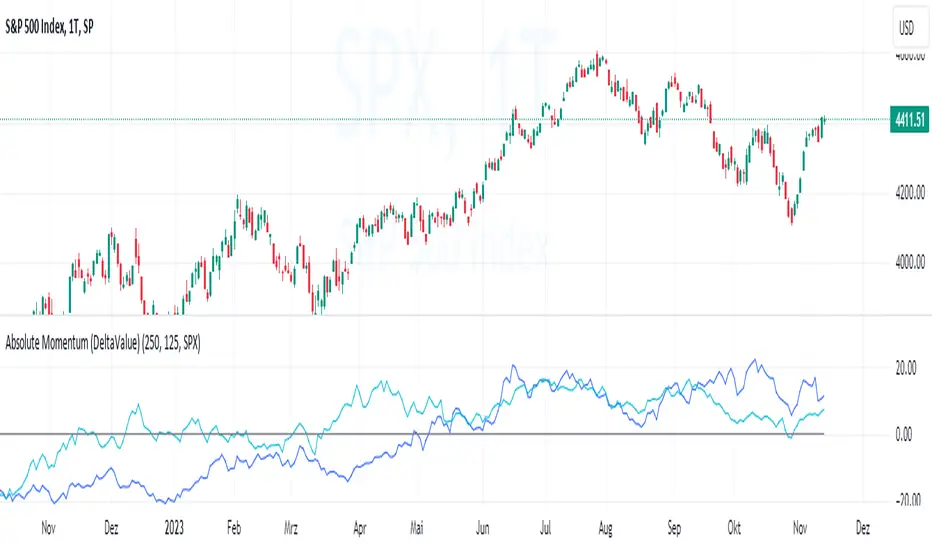
Absolute Momentum (Time Series Momentum)Absolute momentum , also known as time series momentum , focuses on the trend of an asset's own past performance to predict its future performance. It involves analyzing an asset's own historical performance, rather than comparing it to other assets.
The strategy determines whether an asset's price is exhibiting an upward (positive momentum) or downward (negative momentum) trend by assessing the asset's return over a given period (standard look-back period: 12 months or approximately 250 trading days). Some studies recommend calculating momentum by deducting the corresponding Treasury bill rate from the measured performance.
Absolute Momentum Indicator
The Absolute Momentum Indicator displays the rolling 12-month performance (measured over 250 trading days) and plots it against a horizontal line representing 0%. If the indicator crosses above this line, it signifies positive absolute momentum, and conversely, crossing below indicates negative momentum. An additional, optional look-back period input field can be accessed through the settings.
Hint: This indicator is a simplified version, as some academic approaches measure absolute momentum by subtracting risk-free rates from the 12-month performance. However, even with higher rates, the values will still remain close to the 0% line.
Benefits of Absolute Momentum
Absolute momentum, which should not be confused with relative momentum or the momentum indicator, serves as a timing instrument for both individual assets and entire markets.
Gary Antonacci , a key contributor to the absolute momentum strategy (find study below), emphasizes its effectiveness in multi-asset portfolios and its importance in long-only investing. This is particularly evident in a) reducing downside volatility and b) mitigating behavioral biases.
Moskowitz, Ooi, and Pedersen document significant 'time series momentum' across various asset classes, including equity index, currency, commodity, and bond futures, in 58 liquid instruments (find study below). There's a notable persistence in returns ranging from one to 12 months, which tends to partially reverse over longer periods. This pattern aligns with sentiment theories suggesting initial under-reaction followed by delayed over-reaction.
Despite its surprising ease of implementation, the academic community has successfully measured the effects of absolute momentum across decades and in every major asset class, including stocks, bonds, commodities, and foreign exchange (FX).
Strategies for Implementing Absolute Momentum:
To Buy a Stock:
Select a Look-Back Period: Choose a historical period to analyze the stock's performance. A common period is 12 months, but this can vary based on your investment strategy.
Calculate Excess Return: Determine the stock's excess return over this period. You can also assume a risk-free rate of "0" to simplify the process.
Evaluate Momentum:
If the excess return is positive, it indicates positive absolute momentum. This suggests the stock is in an upward trend and could be a good buying opportunity.
If the excess return is negative, it suggests negative momentum, and you might want to delay buying.
Consider further conditions: Align your decision with broader market trends, economic indicators, or fundamental analysis, for additional context.
To Sell a Stock You Own:
Regularly Monitor Performance: Use the same look-back period as for buying (e.g., 12 months) to regularly assess the stock's performance.
Check for Negative Momentum: Calculate the excess return for the look-back period. Again, you can assume a risk-free rate of "0" to simplify the process. If the stock shows negative momentum, it might be time to consider selling.
Consider further conditions:Align your decision with broader market trends, economic indicators, or fundamental analysis, for additional context.
Important note: Note: Entering a position (i.e., buying) based on positive absolute momentum doesn't necessarily mean you must sell it if it later exhibits negative absolute momentum. You can initiate a position using positive absolute momentum as an entry indicator and then continue holding it based on other criteria, such as fundamental analysis.
General Tips:
Reassessment Frequency: Decide how often you will reassess the momentum (monthly, quarterly, etc.).
Remember, while absolute momentum provides a systematic approach, it's recommendable to consider it as part of a broader investment strategy that includes diversification, risk management, fundamental analysis, etc.
Relevant Capital Market Studies:
Antonacci, Gary. "Absolute momentum: A simple rule-based strategy and universal trend-following overlay." Available at SSRN 2244633 (2013)
Moskowitz, Tobias J., Yao Hua Ooi, and Lasse Heje Pedersen. "Time series momentum." Journal of financial economics 104.2 (2012): 228-250
RSI & Backed-Weighted MA StrategyRSI & MA Strategy :
INTRODUCTION :
This strategy is based on two well-known indicators that work best together: the Relative Strength Index (RSI) and the Moving Average (MA). We're going to use the RSI as a trend-follower indicator, rather than a reversal indicator as most are used to. To the signals sent by the RSI, we'll add a condition on the chart's MA, filtering out irrelevant signals and considerably increasing our winning rate. This is a medium/long-term strategy. There's also a money management method enabling us to reinvest part of the profits or reduce the size of orders in the event of substantial losses.
RSI :
The RSI is one of the best-known and most widely used indicators in trading. Its purpose is to warn traders when an asset is overbought or oversold. It was designed to send reversal signals, but we're going to use it as a trend indicator by increasing its length to 20. The RSI formula is as follows :
RSI (n) = 100 - (100 / (1 + (H (n)/L (n))))
With n the length of the RSI, H(n) the average of days closing above the open and L(n) the average of days closing below the open.
MA :
The Moving Average is also widely used in technical analysis, to smooth out variations in an asset. The SMA formula is as follows :
SMA (n) = (P1 + P2 + ... + Pn) / n
where n is the length of the MA.
However, an SMA does not weight any of its terms, which means that the price 10 days ago has the same importance as the price 2 days ago or today's price... That's why in this strategy we use a RWMA, i.e. a back-weighted moving average. It weights old prices more heavily than new ones. This will enable us to limit the impact of short-term variations and focus on the trend that was dominating. The RWMA used weights :
The 4 most recent terms by : 100 / (4+(n-4)*1.30)
The other oldest terms by : weight_4_first_term*1.30
So the older terms are weighted 1.30 more than the more recent ones. The moving average thus traces a trend that accentuates past values and limits the noise of short-term variations.
PARAMETERS :
RSI Length : Lenght of RSI. Default is 20.
MA Type : Choice between a SMA or a RWMA which permits to minimize the impact of short term reversal. Default is RWMA.
MA Length : Length of the selected MA. Default is 19.
RSI Long Signal : Minimum value of RSI to send a LONG signal. Default is 60.
RSI Short signal : Maximum value of RSI to send a SHORT signal. Default is 40.
ROC MA Long Signal : Maximum value of Rate of Change MA to send a LONG signal. Default is 0.
ROC MA Short signal : Minimum value of Rate of Change MA to send a SHORT signal. Default is 0.
TP activation in multiple of ATR : Threshold value to trigger trailing stop Take Profit. This threshold is calculated as multiple of the ATR (Average True Range). Default value is 5 meaning that to trigger the trailing TP the price need to move 5*ATR in the right direction.
Trailing TP in percentage : Percentage value of trailing Take Profit. This Trailing TP follows the profit if it increases, remaining selected percentage below it, but stops if the profit decreases. Default is 3%.
Fixed Ratio : This is the amount of gain or loss at which the order quantity is changed. Default is 400, which means that for each $400 gain or loss, the order size is increased or decreased by a user-selected amount.
Increasing Order Amount : This is the amount to be added to or subtracted from orders when the fixed ratio is reached. The default is $200, which means that for every $400 gain, $200 is reinvested in the strategy. On the other hand, for every $400 loss, the order size is reduced by $200.
Initial capital : $1000
Fees : Interactive Broker fees apply to this strategy. They are set at 0.18% of the trade value.
Slippage : 3 ticks or $0.03 per trade. Corresponds to the latency time between the moment the signal is received and the moment the order is executed by the broker.
Important : A bot has been used to test the different parameters and determine which ones maximize return while limiting drawdown. This strategy is the most optimal on BITSTAMP:ETHUSD with a timeframe set to 6h. Parameters are set as follows :
MA type: RWMA
MA Length: 19
RSI Long Signal: >60
RSI Short Signal : <40
ROC MA Long Signal : <0
ROC MA Short Signal : >0
TP Activation in multiple ATR : 5
Trailing TP in percentage : 3
ENTER RULES :
The principle is very simple:
If the asset is overbought after a bear market, we are LONG.
If the asset is oversold after a bull market, we are SHORT.
We have defined a bear market as follows : Rate of Change (20) RWMA < 0
We have defined a bull market as follows : Rate of Change (20) RWMA > 0
The Rate of Change is calculated using this formula : (RWMA/RWMA(20) - 1)*100
Overbought is defined as follows : RSI > 60
Oversold is defined as follows : RSI < 40
LONG CONDITION :
RSI > 60 and (RWMA/RWMA(20) - 1)*100 < -1
SHORT CONDITION :
RSI < 40 and (RWMA/RWMA(20) - 1)*100 > 1
EXIT RULES FOR WINNING TRADE :
We have a trailing TP allowing us to exit once the price has reached the "TP Activation in multiple ATR" parameter, i.e. 5*ATR by default in the profit direction. TP trailing is triggered at this point, not limiting our gains, and securing our profits at 3% below this trigger threshold.
Remember that the True Range is : maximum(H-L, H-C(1), C-L(1))
with C : Close, H : High, L : Low
The Average True Range is therefore the average of these TRs over a length defined by default in the strategy, i.e. 20.
RISK MANAGEMENT :
This strategy may incur losses. The method for limiting losses is to set a Stop Loss equal to 3*ATR. This means that if the price moves against our position and reaches three times the ATR, we exit with a loss.
Sometimes the ATR can result in a SL set below 10% of the trade value, which is not acceptable. In this case, we set the SL at 10%, limiting losses to a maximum of 10%.
MONEY MANAGEMENT :
The fixed ratio method was used to manage our gains and losses. For each gain of an amount equal to the value of the fixed ratio, we increase the order size by a value defined by the user in the "Increasing order amount" parameter. Similarly, each time we lose an amount equal to the value of the fixed ratio, we decrease the order size by the same user-defined value. This strategy increases both performance and drawdown.
Enjoy the strategy and don't forget to take the trade :)

Narrow Range StrategyNarrow Range Strategy :
INTRODUCTION :
This strategy is based on the Narrow Range Day concept, implying that low volatility will generate higher volatility in the days ahead. The strategy sends us buy and sell signals with well-defined profit targets. It's a medium/long-term strategy. There's also a money management method that allows us to reinvest part of the profits or reduce the size of orders in the event of substantial losses.
NARROW RANGE (NR) DAY :
A Narrow Range Day is a day in which price variations are included in those of a specific day some time before. The high and low of this specific day form the "reference range". In general, we compare these variations with those of 4 or 7 days ago. The mathematical formula for finding an NR4 is :
If low > low(4) and high < high(4) :
nr = true
This implies that the current low is greater than the low of 4 days ago, and the current high is smaller than the high of 4 days ago. So today's volatility is lower than that of 4 days ago, and may be a sign of high volatility to come.
PARAMETERS :
Narrow Range Length : Corresponds to the number of candles back to compare current volatility. The default is 4, allowing comparison of current volatility with that of 4 candles ago.
Stop Loss : Percentage of the reference range on which to set an exit order to limit losses. The minimum value is 0.001, while the maximum is 1. The default value is 0.35.
Fixed Ratio : This is the amount of gain or loss at which the order quantity is changed. The default is 400, which means that for each $400 gain or loss, the order size is increased or decreased by an amount chosen by the user.
Increasing Order Amount : This is the amount to be added to or subtracted from orders when the fixed ratio is reached. The default is $200, which means that for every $400 gain, $200 is reinvested in the strategy. On the other hand, for every $400 loss, the order size is reduced by $200.
Initial capital : $1000
Fees : Interactive Broker fees apply to this strategy. They are set at 0.18% of the trade value.
Slippage : 3 ticks or $0.03 per trade. Corresponds to the latency time between the moment the signal is received and the moment the order is executed by the broker.
Important : A bot was used to test NR4 and NR7 with all possible Stop Losses in order to find out which combination generates the highest return on BITSTAMP:ETHUSD while limiting the drawdown. This strategy is the most optimal with an NR4 and a SL of 35% of the reference range size in 5D timeframe.
BUY AND SHORT SIGNALS :
When an NR is spotted, we create two stop orders on the high and low of the reference range. As soon as there's a breakout from this reference range (shown in blue on the chart), we open a position. We're LONG if there's a breakout on the high and SHORT if there's a breakout on the low. Executing a stop order cancels the second stop order.
RISK MANAGEMENT :
This strategy is subject to losses. We manage our risk with Stop Losses. The user is free to enter a SL as a percentage of the reference range. The maximum amount risked per trade therefore depends on the size of the range. The larger the range, the greater the risk. That's why we have set a maximum Stop Loss to 10% to limiting risks per trade.
The special feature of this strategy is that it targets a precise profit objective. This corresponds to the size of the reference range at the top of the high if you're LONG, or at the bottom of the low if you're short. In the same way, the larger the reference range, the greater the potential profits.
The risk reward remains the same for all trades and amounts to : 100/35 = 2.86. If the reference range is too high, we have set a SL to 10% of the trade value to limit losses. In that case, the risk reward is less than 2.86.
MONEY MANAGEMENT :
The fixed ratio method was used to manage our gains and losses. For each gain of an amount equal to the value of the fixed ratio, we increase the order size by a value defined by the user in the "Increasing order amount" parameter. Similarly, each time we lose an amount equal to the value of the fixed ratio, we decrease the order size by the same user-defined value. This strategy increases both performance and drawdown.
NOTE :
Please note that the strategy is backtested from 2017-01-01. As the timeframe is 5D, this strategy is a medium/long-term strategy. That's why only 37 trades were closed. Be careful, as the test sample is small and performance may not necessarily reflect what may happen in the future.
Enjoy the strategy and don't forget to take the trade :)

hamster-bot MRS 2 (simplified version) MRS - Mean Reversion Strategy (Countertrend) (Envelope strategy)
This script does not claim to be unique and does not mislead anyone. Even the unattractive backtest result is attached. The source code is open. The idea has been described many times in various sources. But at the same time, their collection in one place provides unique opportunities.
Published by popular demand and for ease of use. so that users can track the development of the script and can offer their ideas in the comments. Otherwise, you have to communicate in several telegram chats.
Representative of the family of counter-trend strategies. The basis of the strategy is Mean reversion . You can also read about the Envelope strategy .
Mean reversion , or reversion to the mean, is a theory used in finance that suggests that asset price volatility and historical returns eventually will revert to the long-run mean or average level of the entire dataset.
The strategy is very simple. Has very few settings. Good for beginners to get acquainted with algorithmic trading. A simple adjustment will help avoid overfitting. There are many variations of this strategy, but for understanding it is better to start with this implementation.
Principle of operation.
1)
A conventional MA is being built. (fuchsia line). A limit order is placed on this line to close the position.
2)
(green line) A limit order is placed on this line to open a long position
3)
(red line) A limit order is placed on this line to open a short position
Attention!
Please note that a limit order is used. Conclude that the strategy has a limited capacity. And the results obtained on low-liquid instruments will be too high in the tester. On real auctions there will be a different result.
Note for testing the strategy in the spot market:
When testing in the spot market, do not include both long and short at the same time. It is recommended to test only the long mode on the spot. Short mode for more advanced users.
Settings:
Available types of moving averages:
SMA
EMA
TEMA - triple exponential moving average
DEMA - Double Exponential Moving Average
ZLEMA - Zero lag exponential moving average
WMA - weighted moving average
Hma - Hull Moving Average
Thma - Triple Exponential Hull Moving Average
Ehma - Exponential Hull Moving Average
H - MA built based on highs for n candles | ta.highest(len)
L - MA built based on lows for n candles | ta.lowest(len)
DMA - Donchian Moving Average
A Kalman filter can be applied to all MA
The peculiarity of the strategy is a large selection of MA and the possibility of shifting lines. You can set up a reverse trending strategy on the Donchian channel for example.
Use Long - enable/disable opening a Long position
Use Short - enable/disable opening a Short position
Lot Long, % - % allocated from the deposit for opening a Long position. In the spot market, do not use % greater than 100%
Lot Short, % - allocated % of the deposit for opening a Short position
Start date - the beginning of the testing period
End date - the end of the testing period (Example: only August 2020 can be tested)
Mul - multiplier. Used to offset lines. Example:
Mul = 0.99 is shift -1%
Mul = 1.01 is shift +1%
Non-strict recommendations:
1) Test the SPOT market on crypto exchanges. (The countertrend strategy has liquidation risk on futures)
2) Symbols altcoin/bitcoin or altcoin/altcoin. Example: ETH/BTC or DOGE/ETH
3) Timeframe is usually 1 hour
If the script passes moderation, I will supplement it by adding separate settings for closing long and short positions according to their MA

Renko StrategyRENKO STRATEGY
CAUTION : This strategy must be applied to a candlestick chart (not a Renko chart).
INTRODUCTION :
The Traditional Renko chart has been reproduced and is plotted according to the evolution of the price. It will enable us to receive buy or sell signals and follow major trends. This is a medium/long term strategy and depends a lot on the box size chosen in the parameters. There's also a money management method allowing us to reinvest part of the profits or reduce the size of orders in the event of substantial losses.
RENKO CHART :
Renko chart construction methodology :
The user must first choose the box size. The minimum is 0.00001 and there is no maximum. The default is 10. The user must then choose the source that will define the data on which the calculations will be based (high, low, open, close). By default, close is selected. The first candle on the chart is used to draw the first box with its high and low.
Each time the price changes by the amount of the box size relative to the high or low of the last box, a new box is added above or below the previous one. If price variations are less than the box size, the same box is added next to the previous one. If price variations are N (integer number) times greater than box size, N boxes are added above or below the previous one. Each box added above the previous one is a green box, while each box added below the previous one is a red box.
Conditions for drawing a green box above the previous one :
(source - high_of_the_last_box) / box_size > 1
Condition for drawing a red box below the previous one :
(low_of_the_last_box - source) / box_size > 1
If neither condition is triggered, the same box is drawn next to the previous one.
Example :
The last candle has drawn a box with low 12 and high 14. The box size is therefore 2. The strategy will look at the value of the close each time a candle ends. The current candle closes with a close equal to 15.5. As the variation from the previous high is only 1.5 (which is less than the box size), the same box is added next to the previous one. The next candle closes at 16.2. The price variation is therefore 2.2 compared with the previous high. We can now add a new green box just above the previous one, with a low of 14 and a high of 16. The same process applies if the candle's close is at least one box size below the low of the last box. In this case, a new red box is placed below the previous one.
PARAMETERS :
Source : Allows you to specify which data will be taken into account by the strategy when performing calculations. The default is close.
Box size : Size of Renko graph boxes. This is a very important parameter to choose carefully, as it has a strong impact on the strategy's performance. Defaults to 10.
Fixed Ratio : This is the amount of gain or loss at which the order quantity is changed. The default is 400, meaning that for each $400 gain or loss, the order size is increased or decreased by a user-selected amount.
Increasing Order Amount : This is the amount to be added to or subtracted from orders when the fixed ratio is reached. The default is $200, which means that for every $400 gain, $200 is reinvested in the strategy. On the other hand, for every $400 loss, the order size is reduced by $200.
Initial capital : $1000
Fees : Interactive Broker fees apply to this strategy. They are set at 0.18% of the trade value.
Slippage : 3 ticks or $0.03 per trade. Corresponds to the latency time between the moment the signal is received and the moment the order is executed by the broker.
Important : A bot has been used to test all possible box sizes to find out which one generates the highest return on BITSTAMP:LTCUSD while limiting the drawdown. This strategy is the most optimal with a box size equal to 5.08 in 8h timeframe.
BUY AND SHORT SIGNALS :
As the aim of this strategy is to follow major trends based on price movements, we need to be on the right side of price fluctuation. We trade every box reversal, i.e. we are LONG when the boxes are green indicating an uptrend and SHORT when they are red indicating a downtrend.
RISK MANAGEMENT :
This strategy can incur losses. The size of the box is decisive, as it is used to plot the RENKO chart and thus trigger buy or sell signals. It's also what allows us to manage risk. For every trade, we risk a maximum amount equal to 2 times the size of the box, i.e. :(5.08*2*nb_contract)/trade_value.
MONEY MANAGEMENT :
The fixed ratio method has been used to manage our gains and losses. For each gain of an amount equal to the value of the fixed ratio, we increase the order size by a value defined by the user in the "Increasing order amount" parameter. Similarly, each time we lose an amount equal to the value of the fixed ratio, we decrease the order size by the same user-defined value. This strategy not only increases our performance, but also our drawdown.
Enjoy the strategy and don't forget to take the trade :)
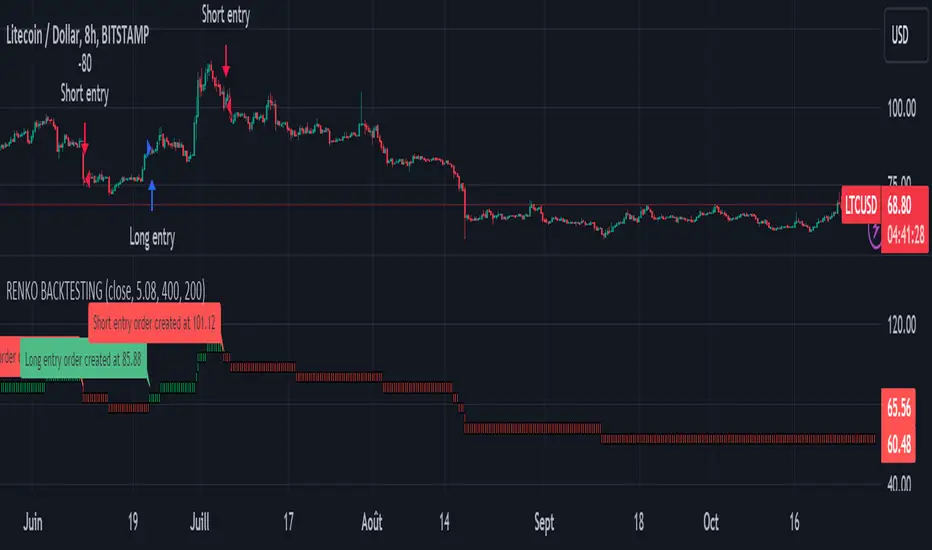
Heatmap MACD Strategy - Pineconnector (Dynamic Alerts)Hello traders
This script is an upgrade of this template script.
Heatmap MACD Strategy
Pineconnector
Pineconnector is a trading bot software that forwards TradingView alerts to your Metatrader 4/5 for automating trading.
Many traders don't know how to dynamically create Pineconnector-compatible alerts using the data from their TradingView scripts.
Traders using trading bots want their alerts to reflect the stop-loss/take-profit/trailing-stop/stop-loss to breakeven options from your script and then create the orders accordingly.
This script showcases how to create Pineconnector alerts dynamically.
Pineconnector doesn't support alerts with multiple Take Profits.
As a workaround, for 2 TPs, I had to open two trades.
It's not optimal, as we end up paying more spreads for that extra trade - however, depending on your trading strategy, it may not be a big deal.
TradingView Alerts
1) You'll have to create one alert per asset X timeframe = 1 chart.
Example : 1 alert for EUR/USD on the 5 minutes chart, 1 alert for EUR/USD on the 15-minute chart (assuming you want your bot to trade the EUR/USD on the 5 and 15-minute timeframes)
2) For each alert, the alert message is pre-configured with the text below
{{strategy.order.alert_message}}
Please leave it as it is.
It's a TradingView native variable that will fetch the alert text messages built by the script.
3) Don't forget to set the webhook URL in the Notifications tab of the TradingView alerts UI.
EA configuration
The Pyramiding in the EA on Metatrader must be set to 2 if you want to trade with 2 TPs => as it's opening 2 trades.
If you only want 1 TP, set the EA Pyramiding to 1.
Regarding the other EA settings, please refer to the Pineconnector documentation on their website.
Logger
The Pineconnector commands are logged in the TradingView logger.
You'll find more information about it from this TradingView blog post
Important Notes
1) This multiple MACDs strategy doesn't matter much.
I could have selected any other indicator or concept for this script post.
I wanted to share an example of how you can quickly upgrade your strategy, making it compatible with Pineconnector.
2) The backtest results aren't relevant for this educational script publication.
I used realistic backtesting data but didn't look too much into optimizing the results, as this isn't the point of why I'm publishing this script.
3) This template is made to take 1 trade per direction at any given time.
Pyramiding is set to 1 on TradingView.
The strategy default settings are:
Initial Capital: 100000 USD
Position Size: 1 contract
Commission Percent: 0.075%
Slippage: 1 tick
No margin/leverage used
For example, those are realistic settings for trading CFD indices with low timeframes but not the best possible settings for all assets/timeframes.
Concept
The Heatmap MACD Strategy allows selecting one MACD in five different timeframes.
You'll get an exit signal whenever one of the 5 MACDs changes direction.
Then, the strategy re-enters whenever all the MACDs are in the same direction again.
It takes:
long trades when all the 5 MACD histograms are bullish
short trades when all the 5 MACD histograms are bearish
You can select the same timeframe multiple times if you don't need five timeframes.
For example, if you only need the 30min, the 1H, and 2H, you can set your timeframes as follow:
30m
30m
30m
1H
2H
Risk Management Features
All the features below are pips-based.
Stop-Loss
Trailing Stop-Loss
Stop-Loss to Breakeven after a certain amount of pips has been reached
Take Profit 1st level and closing X% of the trade
Take Profit 2nd level and close the remaining of the trade
Custom Exit
I added the option ON/OFF to close the opened trade whenever one of the MACD diverges with the others.
Help me help the community
If you see any issue when adding your strategy logic to that template regarding the orders fills on your Metatrader, please let me know in the comments.
I'll use your feedback to make this template more robust. :)
What's next?
I'll publish a more generic template built as a connector so you can connect any indicator to that Pineconnector template.
Then, I'll publish a template for Capitalise AI, ProfitView, AutoView, and Alertatron.
Thank you
Dave
